Evolutionary Coupling Analysis
Predicted and experimental contacts
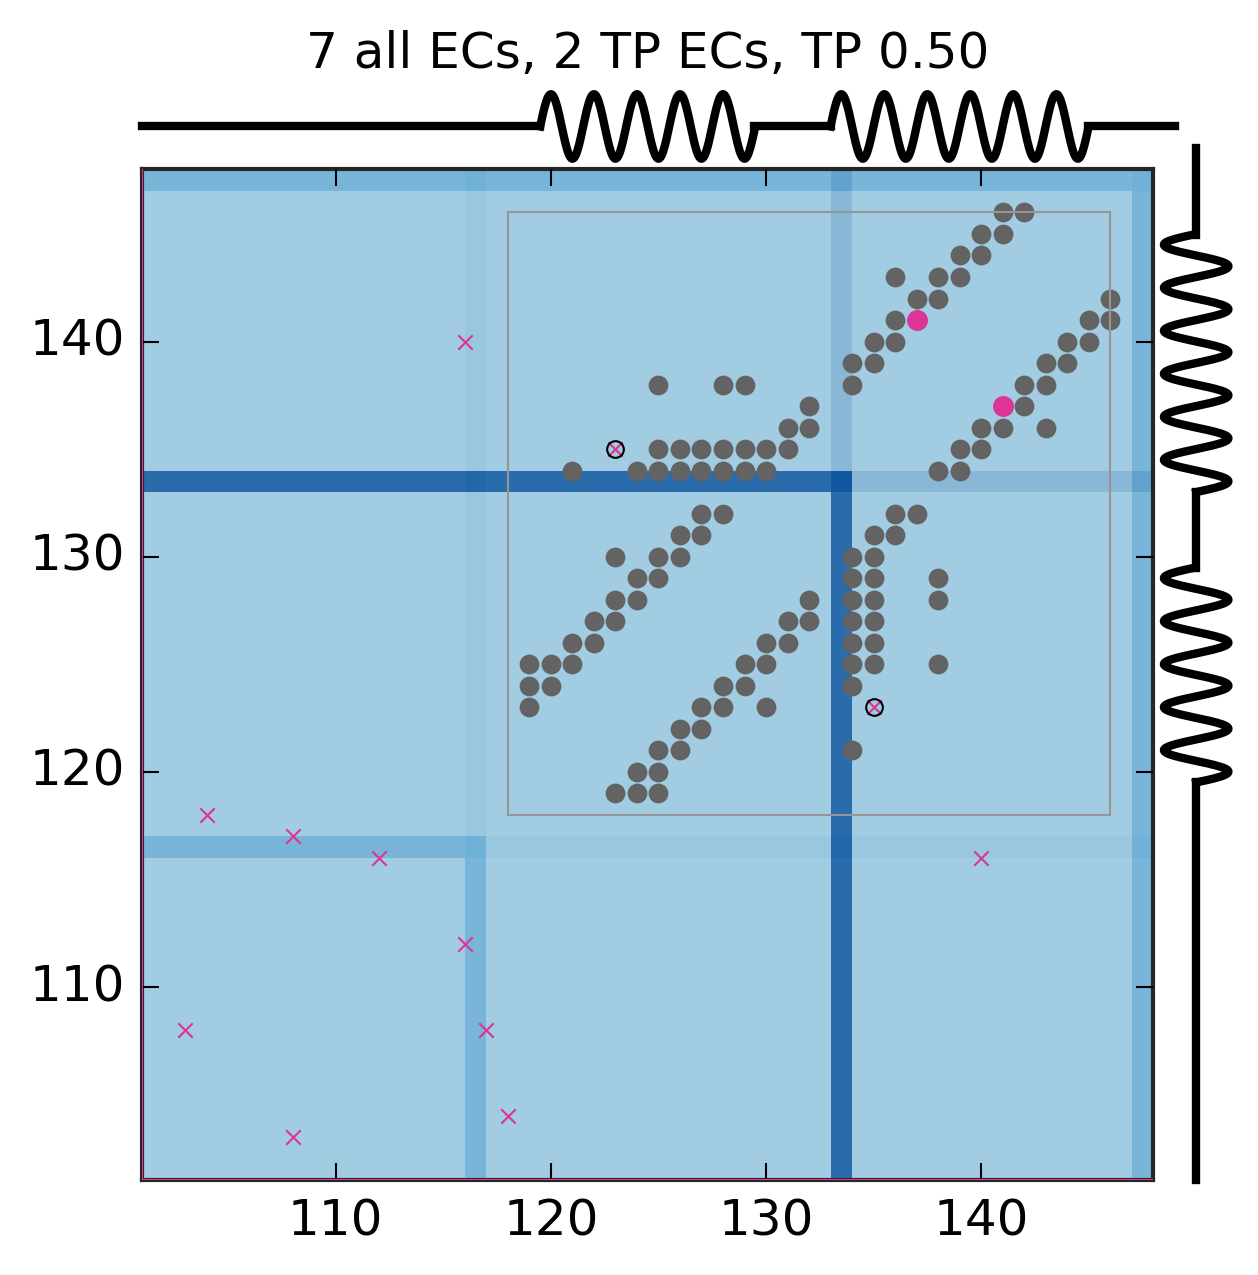
Interactive contact map
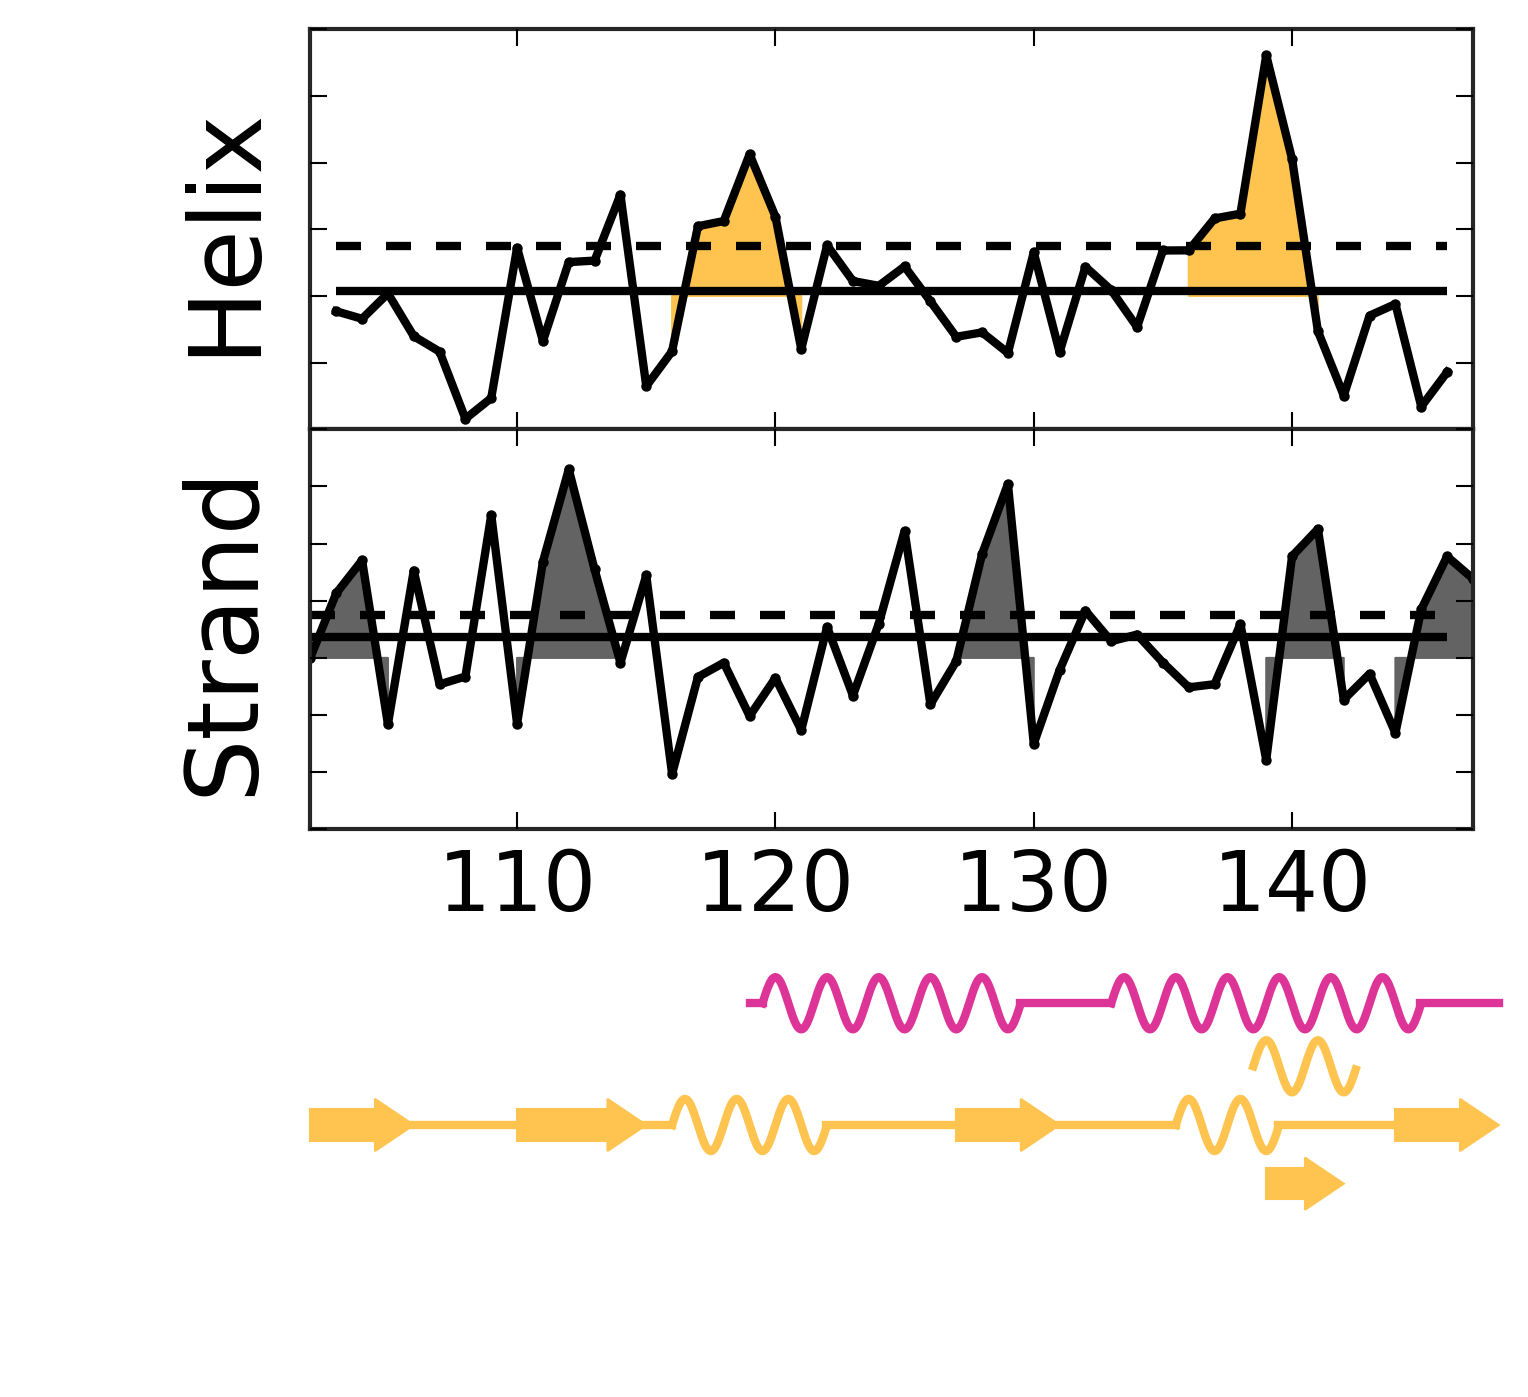
Secondary structure from ECs
Known pdb structures
| pdb | chain |
|---|---|
| 1kdx | B |
EC score distribution and threshold

Top ECs
| Rank | Residue 1 | Amino acid 1 | Residue 2 | Amino acid 2 | EC score |
|---|---|---|---|---|---|
| 1 | 104 | T | 118 | V | 0.26 |
| 2 | 108 | S | 117 | S | 0.20 |
| 3 | 123 | K | 135 | R | 0.20 |
| 4 | 112 | Q | 116 | D | 0.19 |
| 5 | 137 | I | 141 | L | 0.18 |
| 6 | 116 | D | 140 | D | 0.18 |
| 7 | 103 | S | 108 | S | 0.17 |
Alignment robustness analysis
First most common residue correlation
Second most common residue correlation
